 Open Data Science Europe Metadata Catalog
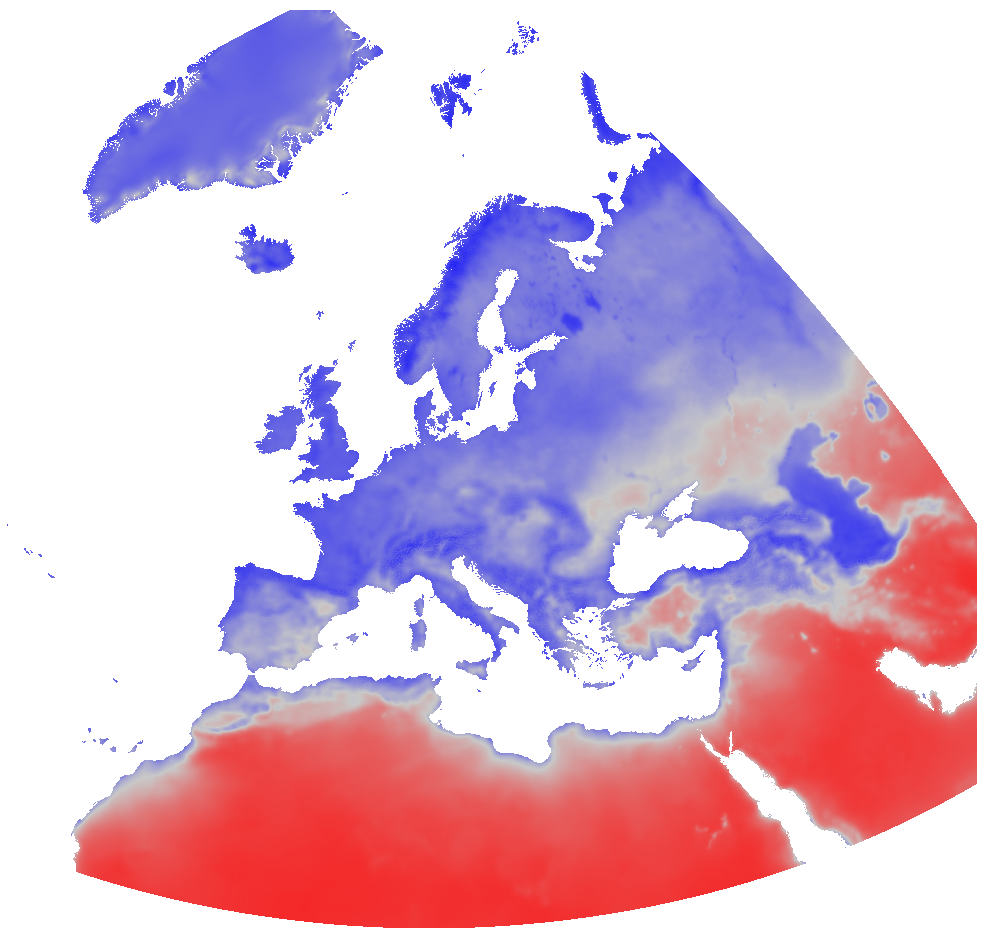
1000 m
Type of resources
Available actions
Topics
Keywords
Contact for the resource
Provided by
Formats
Representation types
Update frequencies
status
Resolution
-
Areas planted with vines, vineyard parcels covering >50% and determining the land use of the area.
-
rgb: Landsat RGB time-series, derived by the median pixel values obtained between June 25 and September 12 on a specific year.
-
natura: Protected areas rasterized from NATURA 2000 (A, B and C site categories) and OSM (IUCN Ia, IUCN Ib, IUCN 2, IUCN 3, IUCN 4, IUCN 5, IUCN 6 and others categories), first to 10m spatial resolution and after downsampled to 30m by spatial average. The overlap areas are indicated in a new category.
-
Overview: era5.copernicus: surface temperature daily averages from 2000 to 2020 resampled with CHELSA to 1 km resolution Traceability (lineage): The data sources used to generate this dataset are ERA5-Land hourly data from 1950 to present (Copernicus Climate Data Store) and CHELSA monthly climatologies. Scientific methodology: The methodology used for downscaling follows established procedures as used by e.g. Worldclim and CHELSA. Usability: The substantial improvement of the spatial resolution together with the high temporal resolution of one day further improve the usability of the original ERA5 Land time series product which is useful for all kind of land surface applications such as flood or drought forecasting. The temporal and spatial resolution of this dataset, the period covered in time, as well as the fixed grid used for the data distribution at any period enables decisions makers, businesses and individuals to access and use more accurate information on land states. Uncertainty quantification: The ERA5-Land dataset, as any other simulation, provides estimates which have some degree of uncertainty. Numerical models can only provide a more or less accurate representation of the real physical processes governing different components of the Earth System. In general, the uncertainty of model estimates grows as we go back in time, because the number of observations available to create a good quality atmospheric forcing is lower. ERA5-land parameter fields can currently be used in combination with the uncertainty of the equivalent ERA5 fields. Data validation approaches: Validation of the ERA5 Land ddataset against multiple in-situ datasets is presented in the reference paper (Muñoz-Sabater et al., 2021). Completeness: The dataset covers the entire Geo-harmonizer region as defined by the landmask raster dataset. However, some small islands might be missing if there are no data in the original ERA5 Land dataset. Consistency: ERA5-Land is a reanalysis dataset providing a consistent view of the evolution of land variables over several decades at an enhanced resolution compared to ERA5. ERA5-Land has been produced by replaying the land component of the ECMWF ERA5 climate reanalysis. Reanalysis combines model data with observations from across the world into a globally complete and consistent dataset using the laws of physics. Reanalysis produces data that goes several decades back in time, providing an accurate description of the climate of the past. Positional accuracy: 1 km spatial resolution Temporal accuracy: Daily maps for the years 2020-2020. Thematic accuracy: The raster values represent minimum, mean, and maximum daily surface temperature in degrees Celsius x 10.
-
Overview: era5.copernicus: precipitation daily sums from 2000 to 2020 resampled with CHELSA to 1 km resolution Traceability (lineage): The data sources used to generate this dataset are ERA5-Land hourly data from 1950 to present (Copernicus Climate Data Store) and CHELSA monthly climatologies. Scientific methodology: The methodology used for downscaling follows established procedures as used by e.g. Worldclim and CHELSA. Usability: The substantial improvement of the spatial resolution together with the high temporal resolution of one day further improve the usability of the original ERA5 Land time series product which is useful for all kind of land surface applications such as flood or drought forecasting. The temporal and spatial resolution of this dataset, the period covered in time, as well as the fixed grid used for the data distribution at any period enables decisions makers, businesses and individuals to access and use more accurate information on land states. Uncertainty quantification: The ERA5-Land dataset, as any other simulation, provides estimates which have some degree of uncertainty. Numerical models can only provide a more or less accurate representation of the real physical processes governing different components of the Earth System. In general, the uncertainty of model estimates grows as we go back in time, because the number of observations available to create a good quality atmospheric forcing is lower. ERA5-land parameter fields can currently be used in combination with the uncertainty of the equivalent ERA5 fields. Data validation approaches: Validation of the ERA5 Land ddataset against multiple in-situ datasets is presented in the reference paper (Muñoz-Sabater et al., 2021). Completeness: The dataset covers the entire Geo-harmonizer region as defined by the landmask raster dataset. However, some small islands might be missing if there are no data in the original ERA5 Land dataset. Consistency: ERA5-Land is a reanalysis dataset providing a consistent view of the evolution of land variables over several decades at an enhanced resolution compared to ERA5. ERA5-Land has been produced by replaying the land component of the ECMWF ERA5 climate reanalysis. Reanalysis combines model data with observations from across the world into a globally complete and consistent dataset using the laws of physics. Reanalysis produces data that goes several decades back in time, providing an accurate description of the climate of the past. Positional accuracy: 1 km spatial resolution Temporal accuracy: Daily maps for the years 2020-2020. Thematic accuracy: The raster values represent cumulative daily precipitation in mm x 10.
-
pm2.5: Number of pixels used in aggregating monthly PM2.5 maps.
-
Overview: ERA5-Land is a reanalysis dataset providing a consistent view of the evolution of land variables over several decades at an enhanced resolution compared to ERA5. ERA5-Land has been produced by replaying the land component of the ECMWF ERA5 climate reanalysis. Reanalysis combines model data with observations from across the world into a globally complete and consistent dataset using the laws of physics. Reanalysis produces data that goes several decades back in time, providing an accurate description of the climate of the past. Processing steps: The original hourly ERA5-Land air temperature 2 m above ground and dewpoint temperature 2 m data has been spatially enhanced from 0.1 degree to 30 arc seconds (approx. 1000 m) spatial resolution by image fusion with CHELSA data (V1.2) (https://chelsa-climate.org/). For each day we used the corresponding monthly long-term average of CHELSA. The aim was to use the fine spatial detail of CHELSA and at the same time preserve the general regional pattern and fine temporal detail of ERA5-Land. The steps included aggregation and enhancement, specifically: 1. spatially aggregate CHELSA to the resolution of ERA5-Land 2. calculate difference of ERA5-Land - aggregated CHELSA 3. interpolate differences with a Gaussian filter to 30 arc seconds. 4. add the interpolated differences to CHELSA Subsequently, the temperature time series have been aggregated on a daily basis. From these, daily relative humidity has been calculated for the time period 01/2000 - 12/2022. Relative humidity (rh2m) has been calculated from air temperature 2 m above ground (Ta) and dewpoint temperature 2 m above ground (Td) using the formula for saturated water pressure from Wright (1997): maximum water pressure = 611.21 * exp(17.502 * Ta / (240.97 + Ta)) actual water pressure = 611.21 * exp(17.502 * Td / (240.97 + Td)) relative humidity = actual water pressure / maximum water pressure The resulting relative humidity has been aggregated to monthly averages. Resultant values have been converted to represent percent * 10, thus covering a theoretical range of [0, 1000]. The data have been reprojected to EU LAEA. File naming scheme (YYYY = year; MM = month): ERA5_land_rh2m_avg_monthly_YYYY_MM.tif Projection + EPSG code: EU LAEA (EPSG: 3035) Spatial extent: north: 6874000 south: -485000 west: 869000 east: 8712000 Spatial resolution: 1000 m Temporal resolution: Monthly Pixel values: Percent * 10 (scaled to Integer; example: value 738 = 73.8 %) Software used: GDAL 3.2.2 and GRASS GIS 8.0.0 Original ERA5-Land dataset license: https://apps.ecmwf.int/datasets/licences/copernicus/ CHELSA climatologies (V1.2): Data used: Karger D.N., Conrad, O., Böhner, J., Kawohl, T., Kreft, H., Soria-Auza, R.W., Zimmermann, N.E, Linder, H.P., Kessler, M. (2018): Data from: Climatologies at high resolution for the earth's land surface areas. Dryad digital repository. http://dx.doi.org/doi:10.5061/dryad.kd1d4 Original peer-reviewed publication: Karger, D.N., Conrad, O., Böhner, J., Kawohl, T., Kreft, H., Soria-Auza, R.W., Zimmermann, N.E., Linder, P., Kessler, M. (2017): Climatologies at high resolution for the Earth land surface areas. Scientific Data. 4 170122. https://doi.org/10.1038/sdata.2017.122 Processed by: mundialis GmbH & Co. KG, Germany (https://www.mundialis.de/) Reference: Wright, J.M. (1997): Federal meteorological handbook no. 3 (FCM-H3-1997). Office of Federal Coordinator for Meteorological Services and Supporting Research. Washington, DC Data is also available in Latitude-Longitude/WGS84 (EPSG: 4326) projection: https://data.mundialis.de/geonetwork/srv/eng/catalog.search#/metadata/b9ce7dba-4130-428d-96f0-9089d8b9f4a5 Acknowledgements: This study was partially funded by EU grant 874850 MOOD. The contents of this publication are the sole responsibility of the authors and don't necessarily reflect the views of the European Commission.
-

Overview: ERA5-Land is a reanalysis dataset providing a consistent view of the evolution of land variables over several decades at an enhanced resolution compared to ERA5. ERA5-Land has been produced by replaying the land component of the ECMWF ERA5 climate reanalysis. Reanalysis combines model data with observations from across the world into a globally complete and consistent dataset using the laws of physics. Reanalysis produces data that goes several decades back in time, providing an accurate description of the climate of the past. Processing steps: The original hourly ERA5-Land air temperature 2 m above ground and dewpoint temperature 2 m data has been spatially enhanced from 0.1 degree to 30 arc seconds (approx. 1000 m) spatial resolution by image fusion with CHELSA data (V1.2) (https://chelsa-climate.org/). For each day we used the corresponding monthly long-term average of CHELSA. The aim was to use the fine spatial detail of CHELSA and at the same time preserve the general regional pattern and fine temporal detail of ERA5-Land. The steps included aggregation and enhancement, specifically: 1. spatially aggregate CHELSA to the resolution of ERA5-Land 2. calculate difference of ERA5-Land - aggregated CHELSA 3. interpolate differences with a Gaussian filter to 30 arc seconds. 4. add the interpolated differences to CHELSA Subsequently, the temperature time series have been aggregated on a daily basis. From these, daily relative humidity has been calculated for the time period 01/2000 - 07/2021. Relative humidity (rh2m) has been calculated from air temperature 2 m above ground (Ta) and dewpoint temperature 2 m above ground (Td) using the formula for saturated water pressure from Wright (1997): maximum water pressure = 611.21 * exp(17.502 * Ta / (240.97 + Ta)) actual water pressure = 611.21 * exp(17.502 * Td / (240.97 + Td)) relative humidity = actual water pressure / maximum water pressure Data provided is the daily averages of relative humidity. Resultant values have been converted to represent percent * 10, thus covering a theoretical range of [0, 1000]. The data have been reprojected to EU LAEA. File naming scheme (YYYY = year; MM = month; DD = day): ERA5_land_rh2m_avg_daily_YYYYMMDD.tif Projection + EPSG code: EU LAEA (EPSG: 3035) Spatial extent: north: 6874000 south: -485000 west: 869000 east: 8712000 Spatial resolution: 1000 m Temporal resolution: Daily Pixel values: Percent * 10 (scaled to Integer; example: value 738 = 73.8 %) Software used: GDAL 3.2.2 and GRASS GIS 8.0.0 Original ERA5-Land dataset license: https://apps.ecmwf.int/datasets/licences/copernicus/ CHELSA climatologies (V1.2): Data used: Karger D.N., Conrad, O., Böhner, J., Kawohl, T., Kreft, H., Soria-Auza, R.W., Zimmermann, N.E, Linder, H.P., Kessler, M. (2018): Data from: Climatologies at high resolution for the earth's land surface areas. Dryad digital repository. http://dx.doi.org/doi:10.5061/dryad.kd1d4 Original peer-reviewed publication: Karger, D.N., Conrad, O., Böhner, J., Kawohl, T., Kreft, H., Soria-Auza, R.W., Zimmermann, N.E., Linder, P., Kessler, M. (2017): Climatologies at high resolution for the Earth land surface areas. Scientific Data. 4 170122. https://doi.org/10.1038/sdata.2017.122 Processed by: mundialis GmbH & Co. KG, Germany (https://www.mundialis.de/) Reference: Wright, J.M. (1997): Federal meteorological handbook no. 3 (FCM-H3-1997). Office of Federal Coordinator for Meteorological Services and Supporting Research. Washington, DC Acknowledgements: This study was partially funded by EU grant 874850 MOOD. The contents of this publication are the sole responsibility of the authors and don't necessarily reflect the views of the European Commission.
-
Overview: Aerosol Optical Depth (AOD) at 550 nm Traceability (lineage): The data source used to generate this dataset are daily Aerosol Optical Depth (AOD) at 550 nm with 1 km spatial resolution from the MCD19A2 product of MODIS collection 6 for the years 2018-2020 (https://lpdaac.usgs.gov/products/mcd19a2v006/), daily modeled AOD at 550 nm with 80 km spatial resolution from Copernicus Atmosphere Monitoring Service (CAMS) for the years 2018-2020, and elevations from the worldwide digital surface model of the Japan Aerospace Exploration Agency (JAXA) (https://www.eorc.jaxa.jp/ALOS/). NASA’s Aerosols Robotic Network (AERONET) ground measurements were used to validate this dataset. Scientific methodology: The outcome of the scheme was a geo-harmonized atmospheric dataset for aerosol optical depth (GHADA) at 550 nm with 1 km spatial resolution and full coverage over Europe. Daily AOD maps were created by training an optimized space-time extra trees model for each year 2018-2020. The results have shown that our trained models reach a prediction accuracy up to 95% when predicting the missing values in the MODIS MCD19A2 product. Usability: AOD maps can be used for future air quality studies concerning Europe. Uncertainty quantification: nan Data validation approaches: GHADA was validated using AOD measurements from AERONET stations across Europe. Completeness: The raster files cover the entire Geo-harmonizer region. Consistency: nan Positional accuracy: 1 km spatial resolution Temporal accuracy: Daily maps for 3 years, 2018-2020. Thematic accuracy: nan
-
pm2.5: Monthly PM2.5 maps aggregated from the daily PM2.5 predictions.